Tools:
Illustrator, Adobe Aero
Recognition:
Featured in Purdue's Annual VCD Poster Exhibition 2023
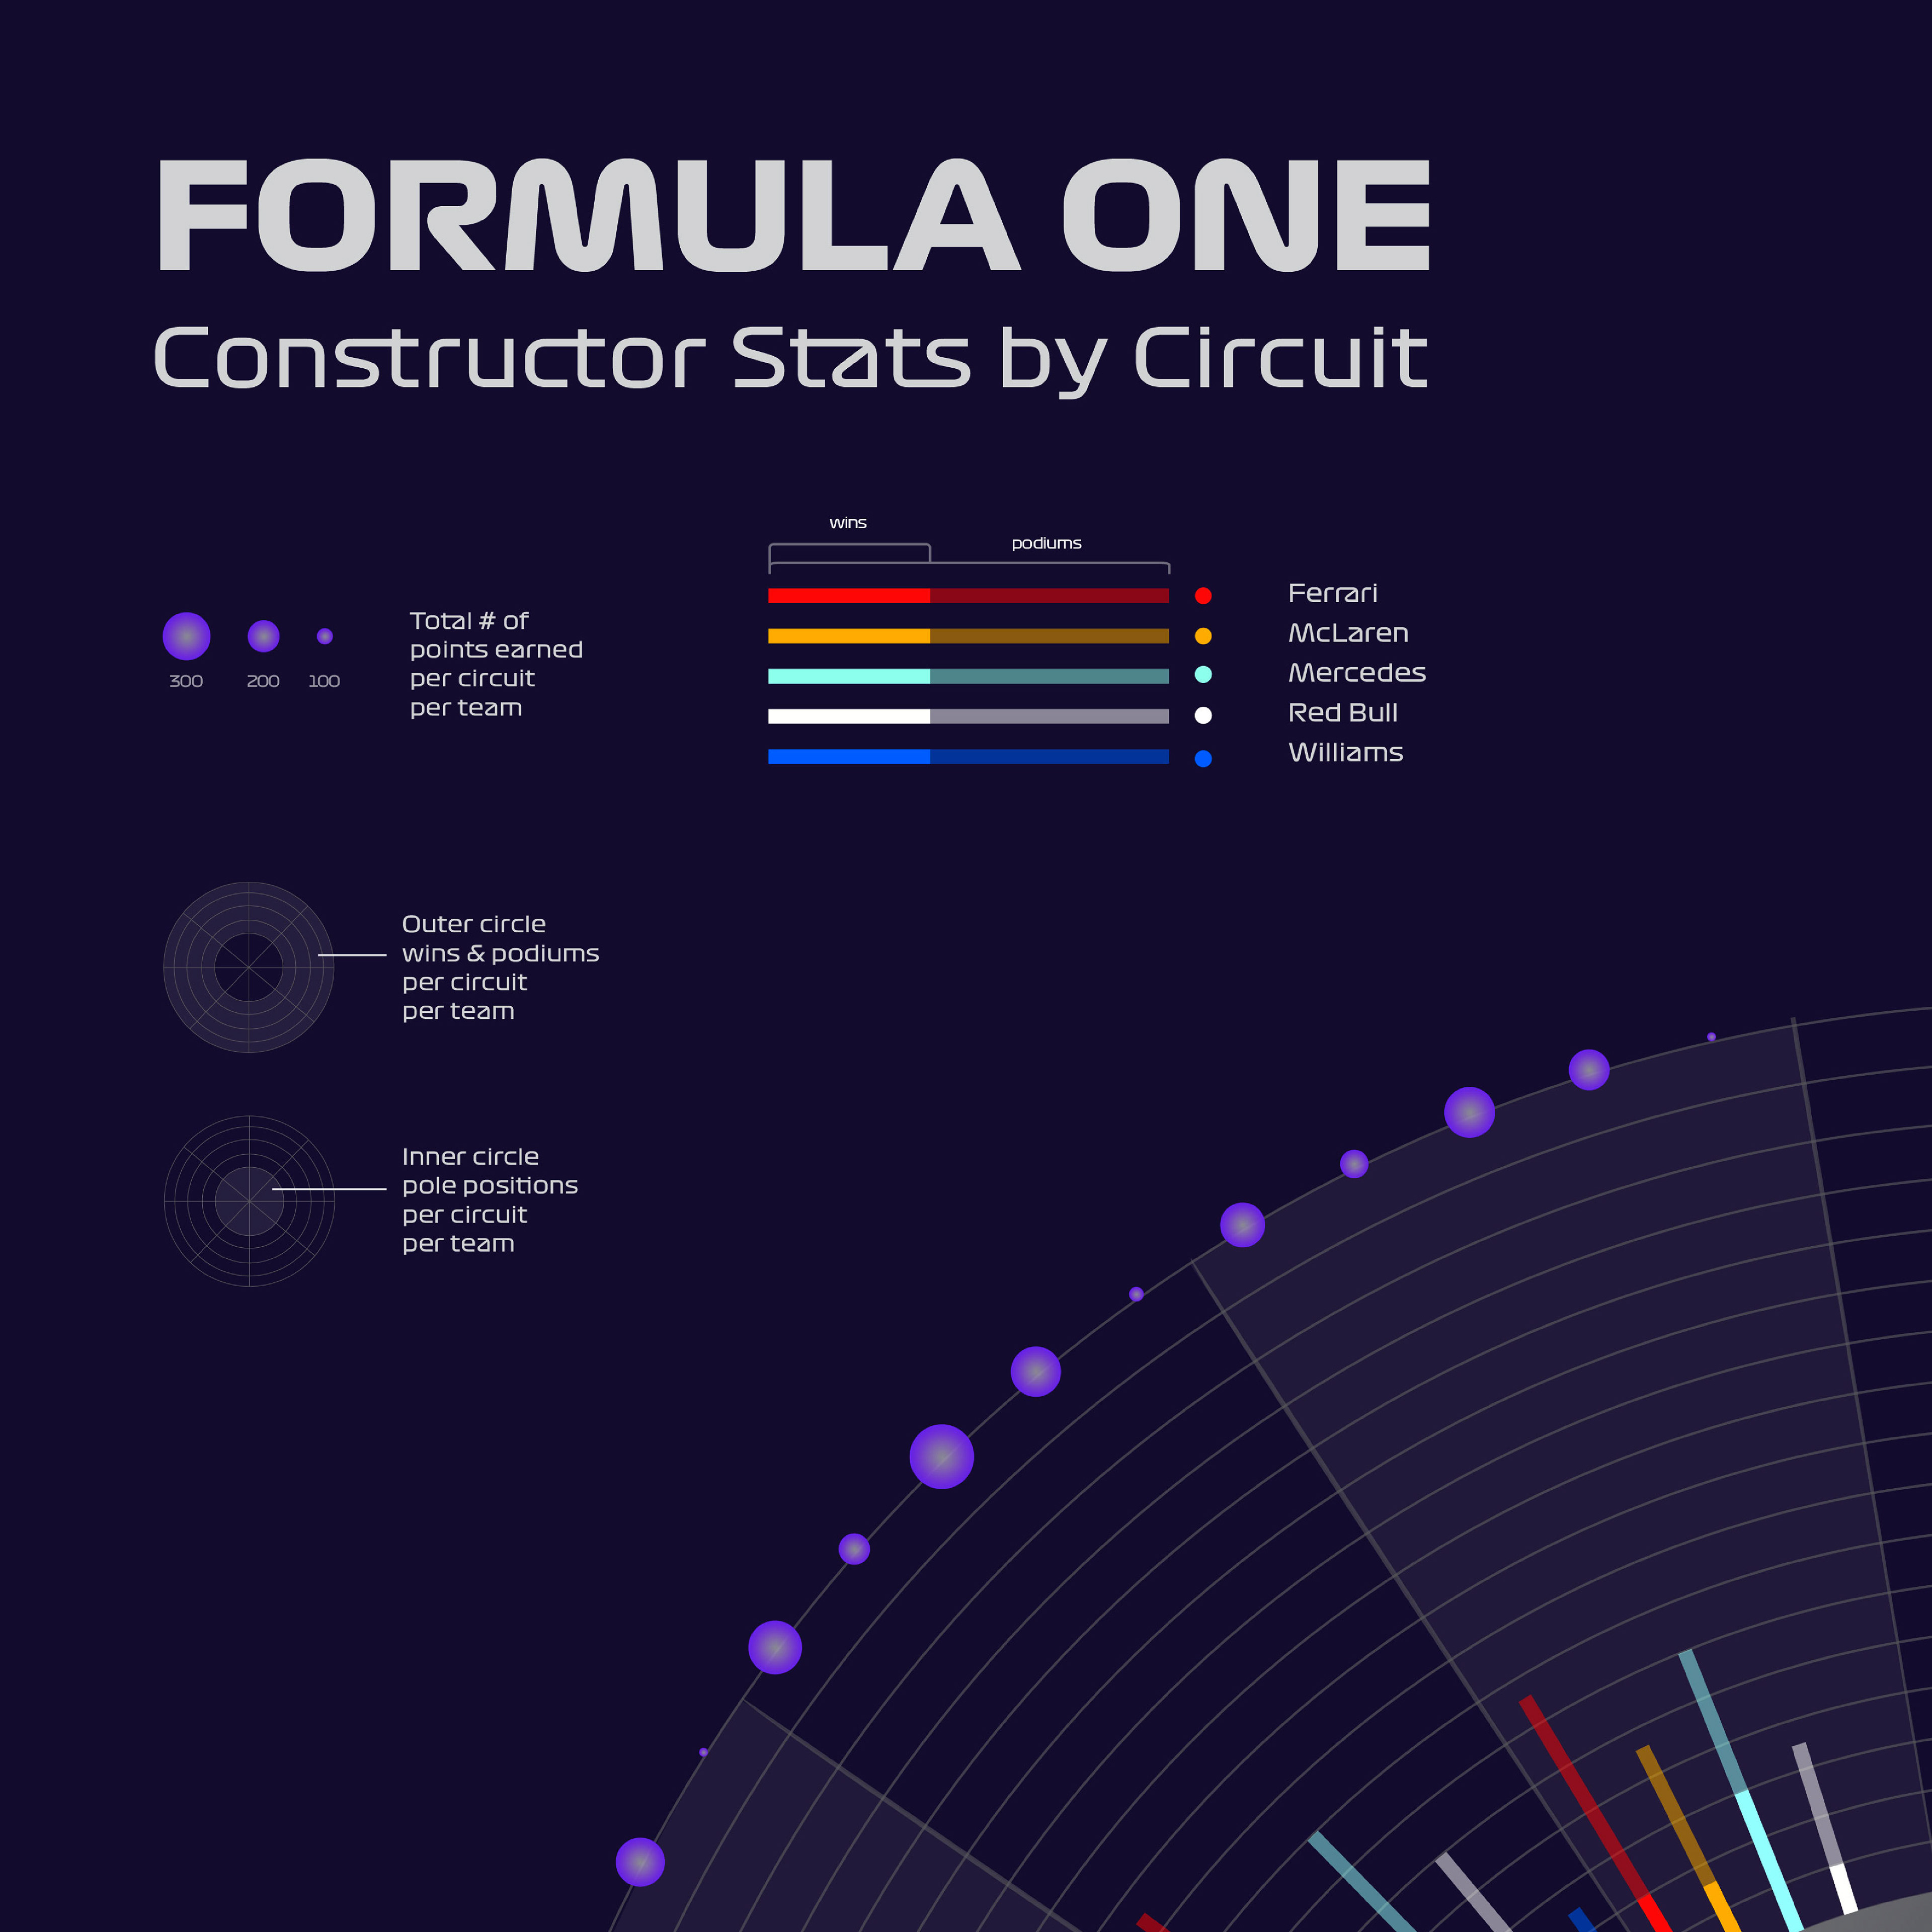
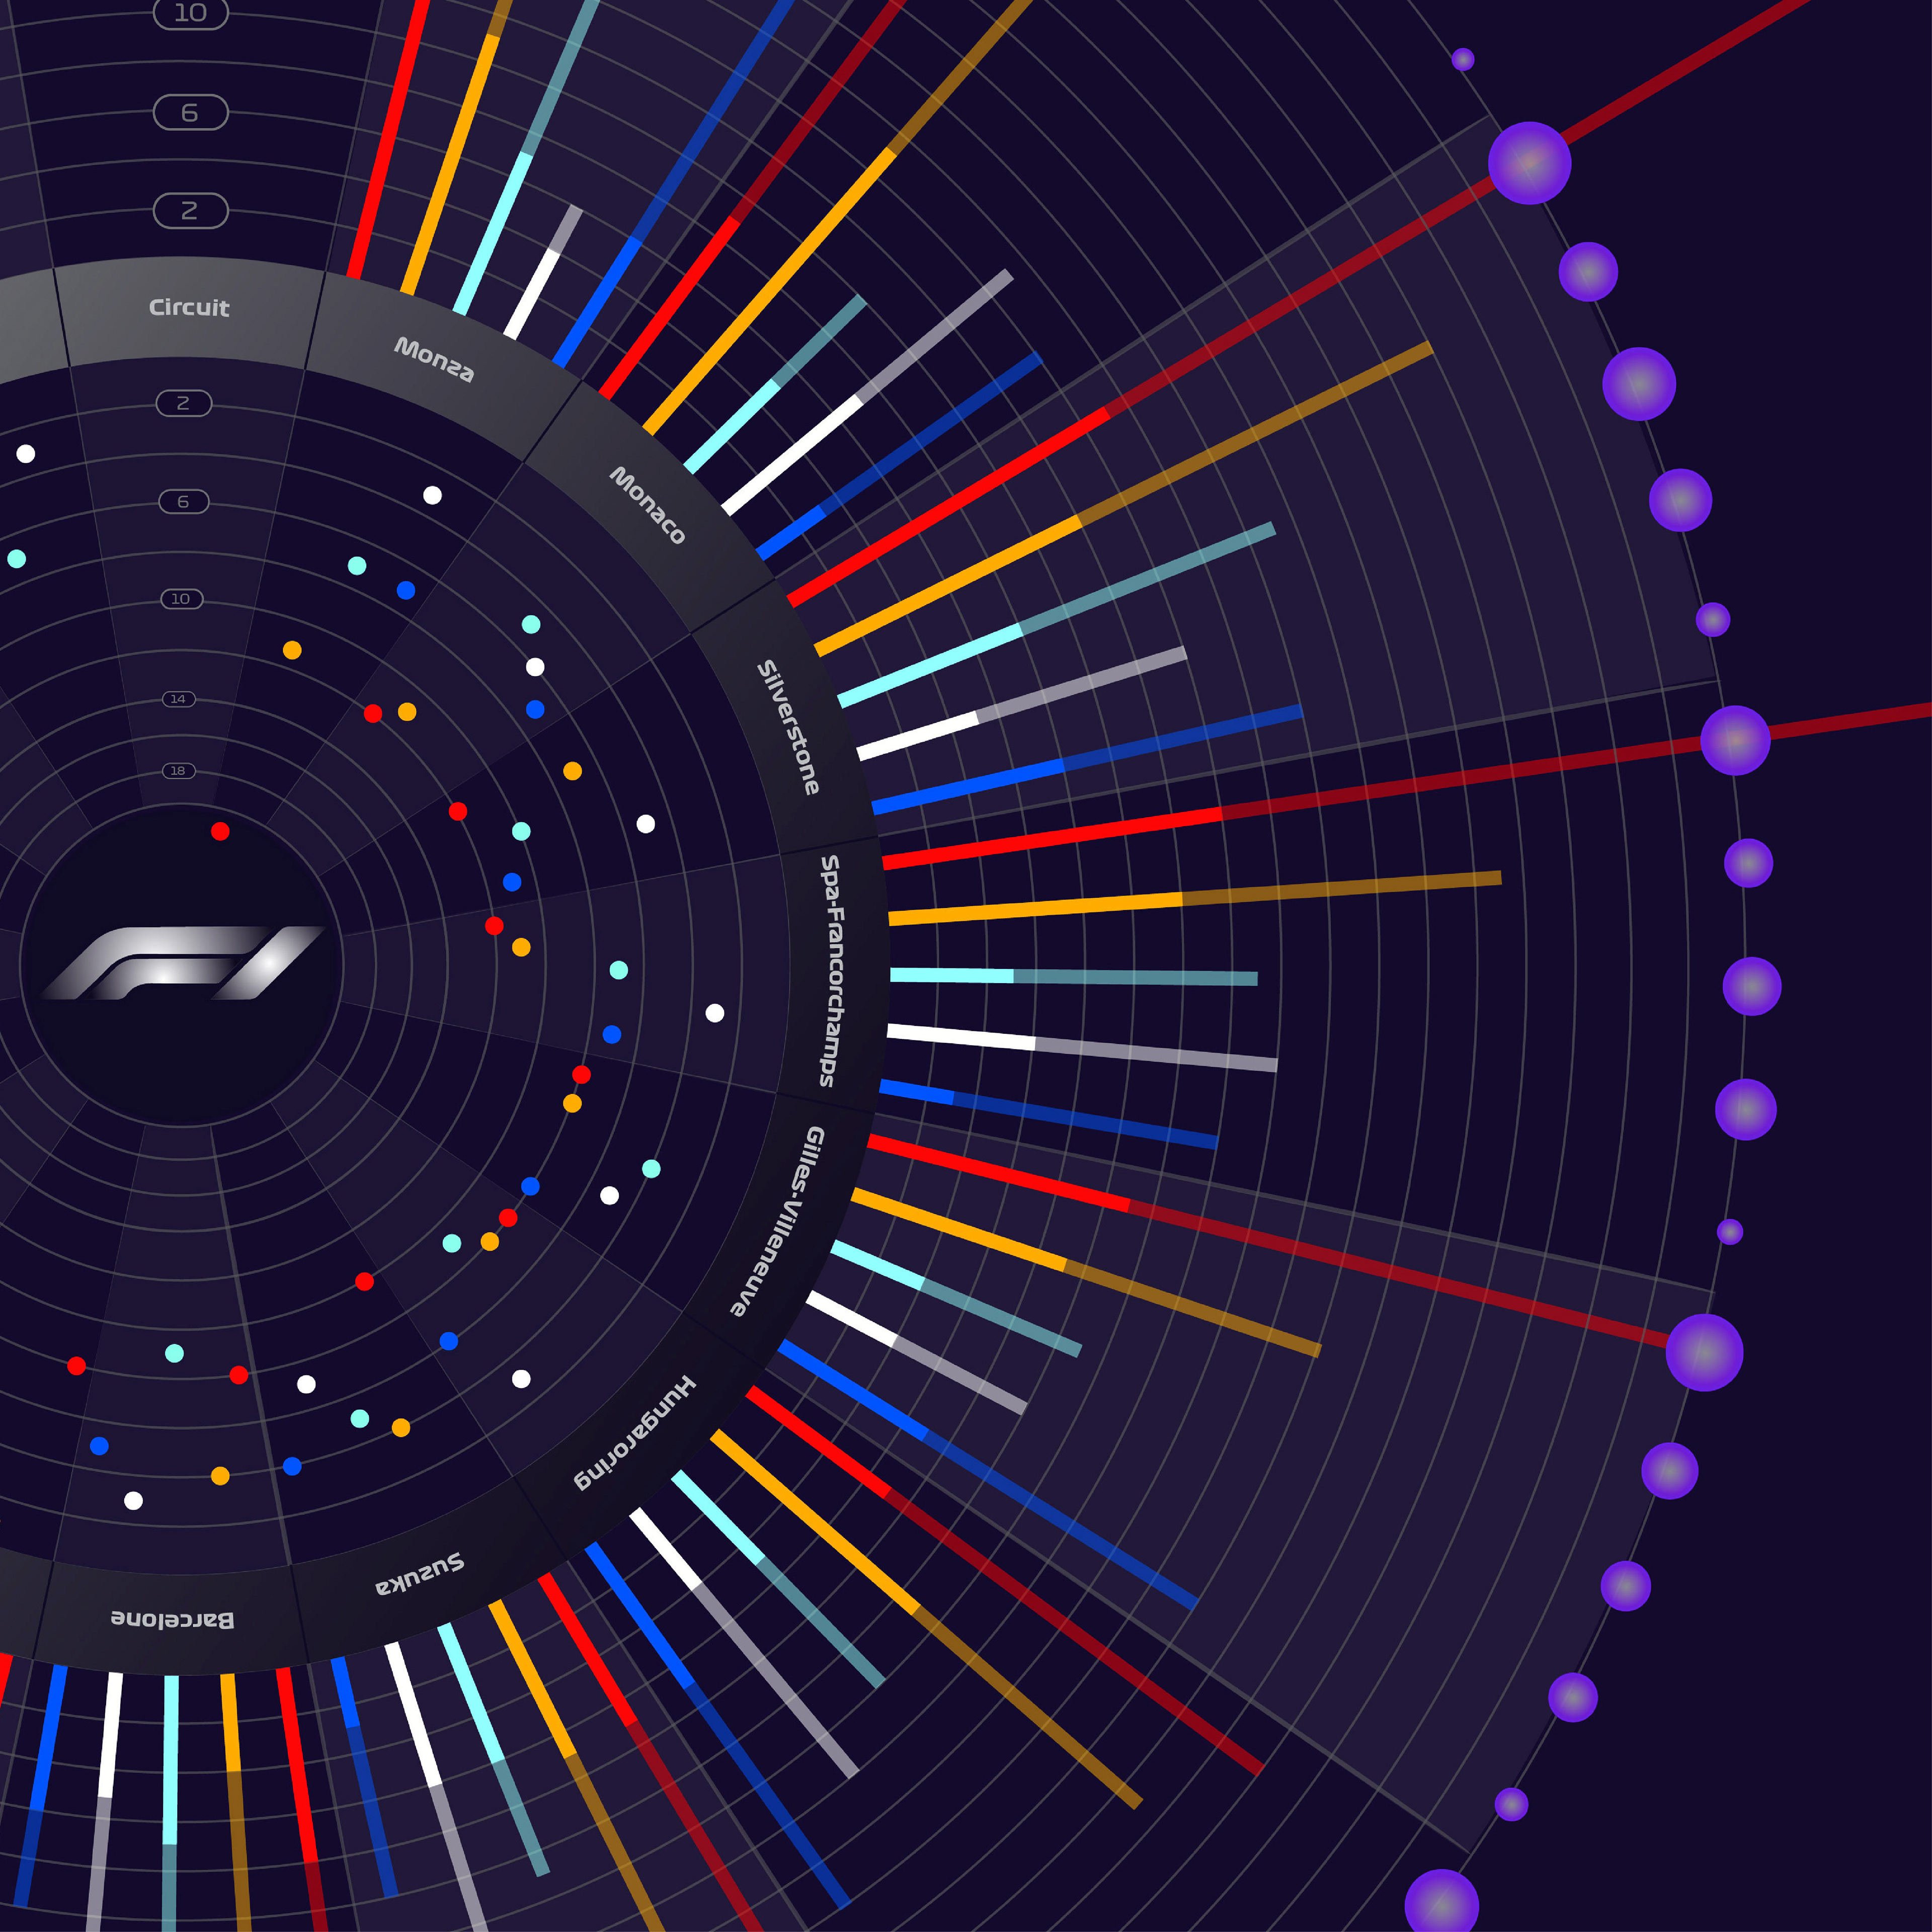
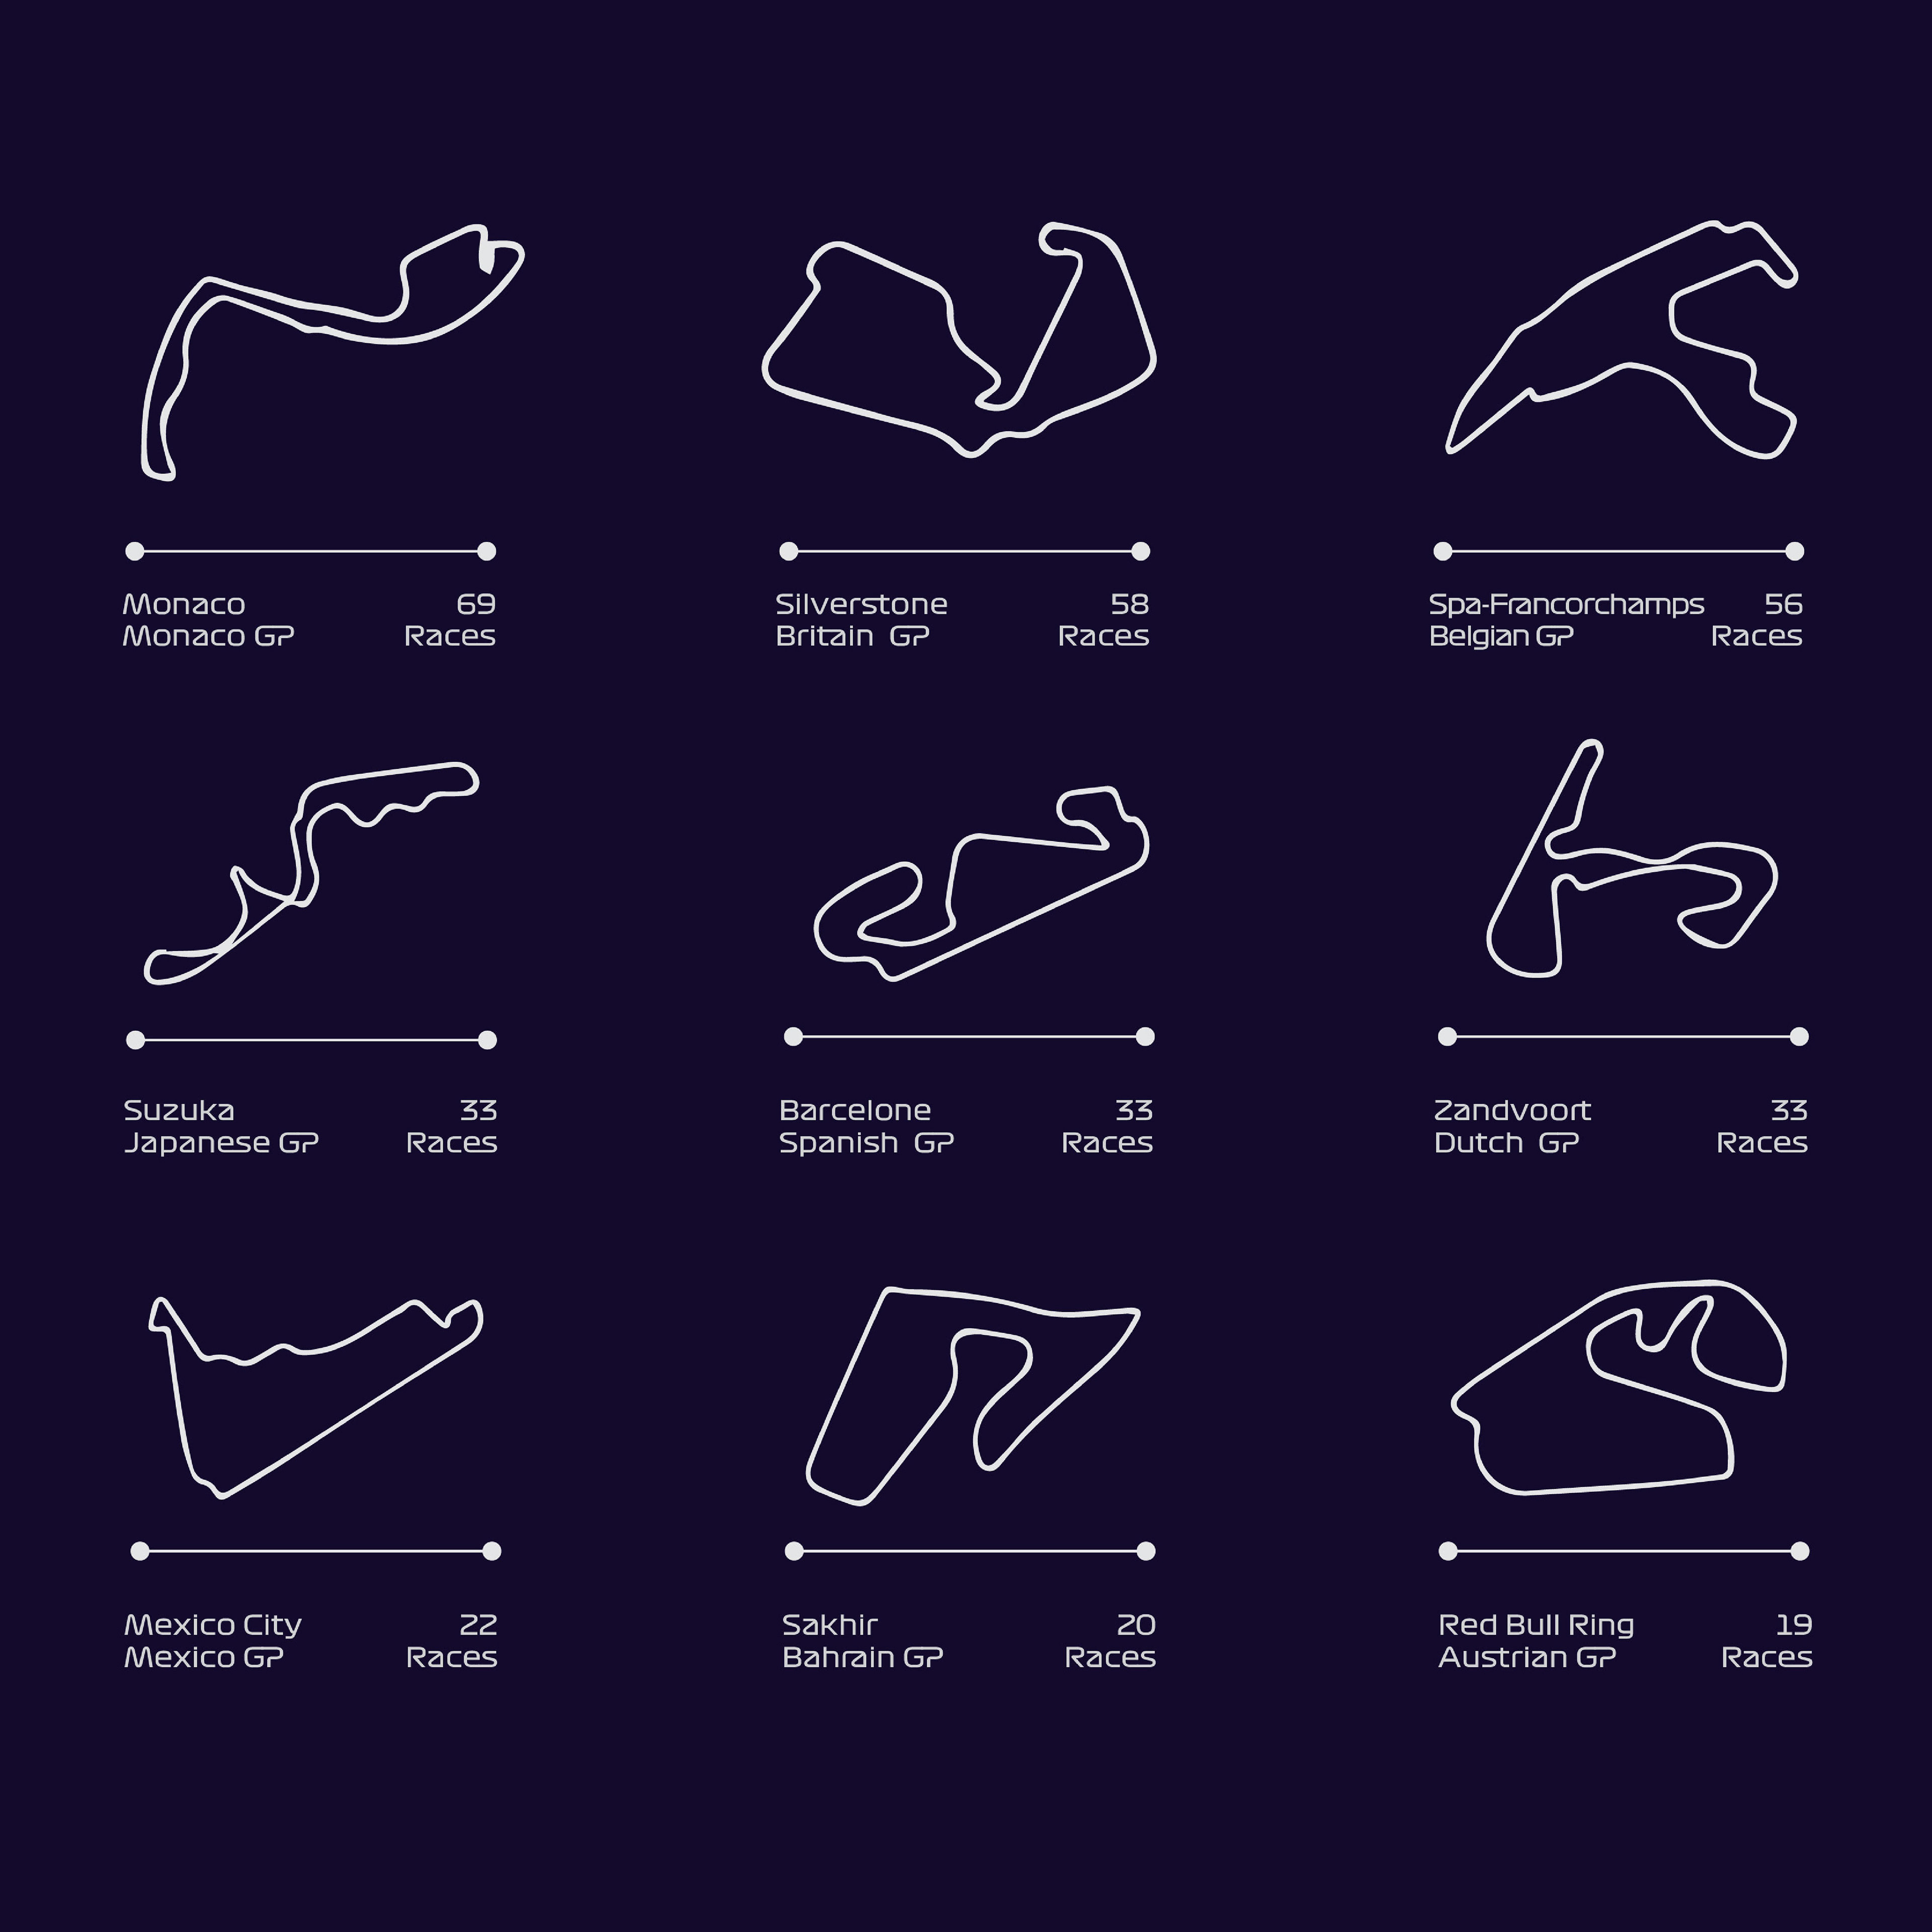
This visualization breaks down the performance stats for the Formula One teams Ferrari, McLaren, Mercedes, Red Bull, and Williams on fifteen circuits that are on the 2024 schedule. The goal of this data visualization is to compare the success rates on each of the circuits for the contractors to determine if there is a history of one team dominating a track going into next season.


